How the CMO of OMHU uses Zigpoll to attribute sales and understand the length of customer journeys
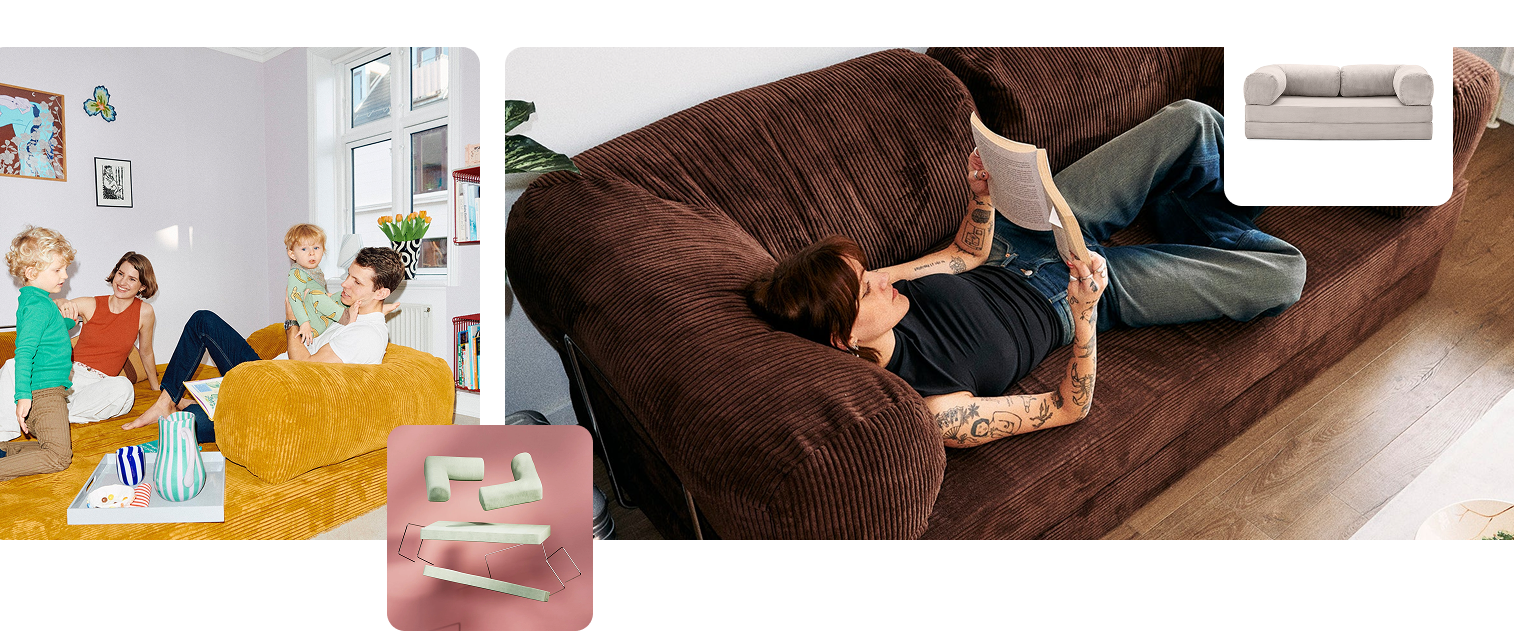
OMHU is a Danish furniture brand, and their core product is the TEDDY couch, a convertible sofa that can be transitioned into a double bed.
We had the privilege chatting with Alex Wulsch, OMHU’s CMO to understand how they use Zigpoll to:
- Determine the length of their customer journey to adjust their ad frequencies and retargeting windows
- Gain detailed, accurate attribution across different international markets when META attribution software overreports its impact
- Quantify the impact of referrals and word of mouth on their business
Understanding the length of customers journeys
One of Alex’s first tasks as CMO was to understand the length of the customer journey, but traditional tools such as Google Analytics were not effective for this:
“There is no real way to find this data through any of the tools that we're generally working with, especially with cookie blockers and the iOS 14. We just can't get that data anymore.”
Complicating this further was OMHU’s unique purchasing journey:
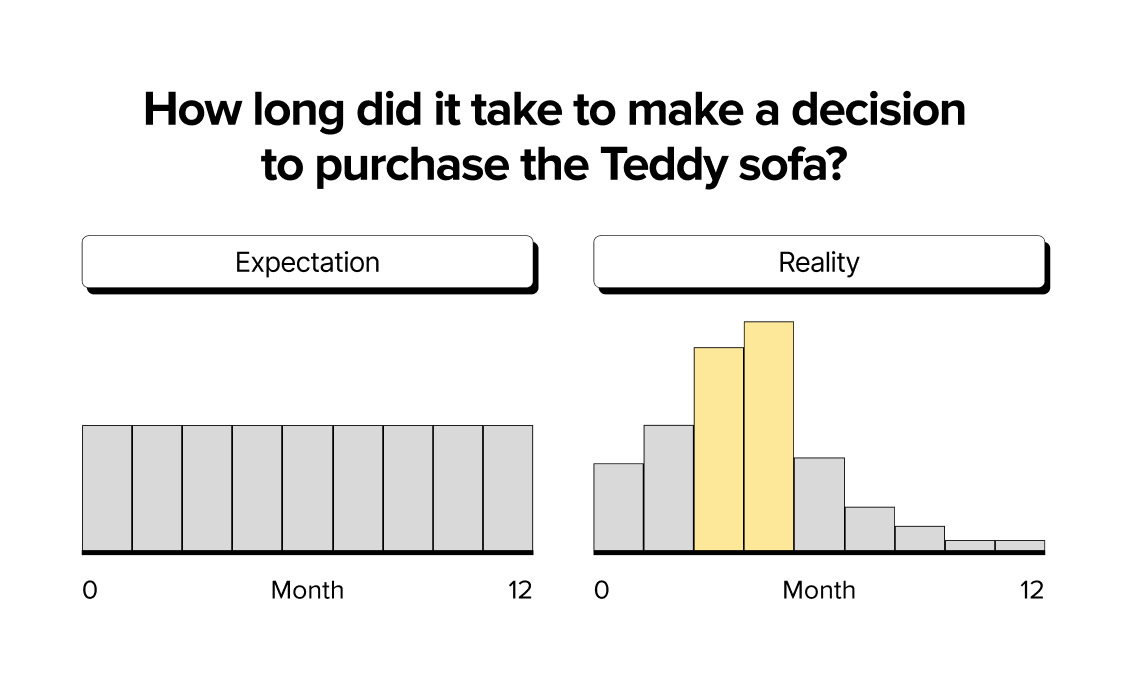
“We assumed that the journey was much more fragmented, that it would be evenly split across one, two, three, four, five, six, seven, all the way up to 12 months. But what we saw was that it's peaking at around three to six months.”
With this realization, the OMHU team is using the data to consider changes to ad frequencies, targeting customers more frequently within this purchase window.
Allocating budgets based on post purchase survey data
OMHU operates in over 20 countries, with each market responding differently to marketing channels.
As CMO, Alex wanted to gain a better understanding of which marketing channels were actually driving impact.
One example - in Poland, using post purchase surveys asking “How did you hear about us?” allowed them to discover that META was overreporting the influence and impact of paid ads.
“Inside ads manager, it was saying we had a really good ROAS, but when we looked at the post purchase survey, nobody attributed their purchase to META. They credited one big influencer that we had during that time period.”
They use this detailed attribution data to more efficiently allocate their marketing budgets by market:
“It really helps us control our budget. I think that's the main one, reducing or increasing budgets and markets based on post-purchase survey data.”
Quantifying the impact of word of mouth and referrals
One surprising result from OMHU’s post purchase attribution surveys was that 20% of their sales were driven by word of mouth and recommendations from past customers.
Traditionally, this is a data point that is impossible to quantify. Alex sees this data point as an indicator of OMHU’s strong product market fit, while also exploring how they can capitalize on this trend by investing more in referrals.
“Having a high word of mouth percentage is a good indicator of product market fit. Once we saw those numbers, we were quite happy and surprised. We're spending a lot of media budget, so seeing that 20% of the sales came from recommendations. That was quite surprising!”


