What are the best metrics to measure user engagement?
Event-based analytics vs session replay vs GA4: choose the best tool for cohorts, replays and traffic signals.

Event-based product analytics (Amplitude, Mixpanel) are best for depth and cohorts; session-replay/experience tools (Contentsquare, FullStory) find UX friction; GA4 gives free traffic-level signals. Pick metrics that match your activation and retention goals.
At a glance
| Option | Best for | Starting price (paid plan) | Free plan | Cohorts & retention reporting | Source |
|---|---|---|---|---|---|
| Amplitude | Product teams, deep cohorts | Usage-based (volume pricing) | Yes | Yes | amplitude.com/pricing |
| Mixpanel | Funnels, retention, experiments | $140/mo (example 1.5M events tier, monthly billing) | Yes | Yes | mixpanel.com/pricing |
| Contentsquare (Hotjar) | Session replay, heatmaps, journeys | From $39/mo (Growth plan) | Yes | Partial | contentsquare.com/pricing |
| FullStory | Full-session capture, debugging | Quote only | Yes (30k sessions free) | Partial | fullstory.com/plans |
| Google Analytics 4 (GA4) | Free traffic & acquisition signals | Quote only (Analytics 360) | Yes | Yes | support.google.com/marketingplatform/answer/9013858 |
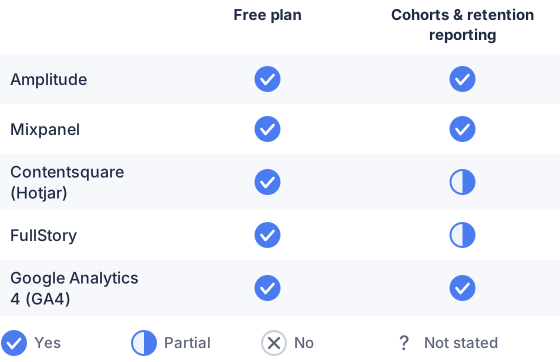
From the sourced table above, checked November 2026.
Amplitude: best for product teams who need cohort depth
Amplitude focuses on event-based product analytics, cohort retention, and feature-adoption analysis. It keeps an extensive free allowance and scales by usage, which suits teams that want deep behavioral segmentation and predictive retention tools but can make bills grow as instrumentation increases. It is less useful if you only need lightweight session replay or simple page-level traffic numbers. (amplitude.com)
Mixpanel: best for funnels, stickiness, and self-serve analysis
Mixpanel gives straightforward funnel and retention reports and exposes event-volume pricing so teams can estimate cost by traffic. It is strong for teams that want fast funnel iteration, experimentation, and a clear path from events to cohorts, though very large event volumes push you to custom pricing. Mixpanel publishes per-volume monthly examples on its pricing page. (mixpanel.com)
Contentsquare (Hotjar): best when you want session replay plus heatmaps
Contentsquare now hosts Hotjar-style session replays, heatmaps and journey analysis, with a free tier and a Growth plan listed from $39/month. It excels at diagnosing UX friction and visualizing where users hesitate, but it is not a full product-analytics platform for long-term cohort modelling unless you buy higher tiers. Check session-capture and retention limits when evaluating. (contentsquare.com)
FullStory: best for precise session capture and technical debugging
FullStory captures full sessions and rich console/network logs for debugging and qualitative analysis; it lists a permanent free tier (30k sessions) but does not publish paid plan prices (quote only). That makes it a good fit when you need exact replay and privacy controls, and less convenient if you need transparent list pricing. (fullstory.com)
What are the best metrics to measure user engagement?
The best metrics are activation rate, retention (cohort retention curves), DAU/MAU (stickiness), engagement depth (events per active user), and task-specific conversion rates. Start with activation and retention because they link to long-term value: activation measures whether a new user reaches an “aha” milestone, while retention cohorts show who returns over days or months. DAU/MAU captures habitual use; engagement depth and feature adoption show which product parts deliver value. These are standard product-analytics priorities used across vendors and described by Amplitude and Mixpanel. (amplitude.com)
How do you track and calculate these engagement metrics?
Track event-level actions (page views, clicks, purchases) and a stable user identifier, then use those events to compute metrics:
- Activation rate = (users who hit activation event within timeframe ÷ new users) × 100. Define the activation event carefully. (amplitude.com)
- Retention (cohort) = percent of a signup cohort returning (or performing a value event) in subsequent periods; plot a retention curve by cohort to detect drop-off moments. Use weekly or monthly cadence depending on your product. (amplitude.com)
- DAU/MAU = (average daily active users ÷ monthly active users) × 100; use consistent “active” definitions. This ratio is a simple stickiness proxy. (mixpanel.com)
- Engagement depth = events per active user or session duration; segment by cohort to see whether deeper engagement correlates with retention. (amplitude.com)
Implement these in an analytics tool (Amplitude, Mixpanel, GA4) or in SQL against your event warehouse. Product analytics platforms provide built-in reports for MAU/DAU, retention cohorts, funnels, and custom formulas; GA4 supplies event-based monetization and funnel events for ecommerce. (mixpanel.com)
Which metrics are leading indicators of future retention?
Early activation (day-1 and day-7 activation), time-to-first-value, engagement frequency (initial DAU/WAU), and feature adoption are the strongest leading indicators. Amplitude’s analysis finds early activation correlates closely with longer-term retention: teams that get users to the activation milestone quickly tend to retain them at higher rates. Measuring whether new users perform the key value action inside the first session or week is more predictive than raw acquisition numbers. (amplitude.com)
How to choose engagement metrics for my ecommerce business?
Pick metrics tied to your funnel and revenue: acquisition → activation → purchase → repeat behavior. Core ecommerce engagement metrics are: add-to-cart rate and cart abandonment, conversion rate (checkout complete ÷ visits), average order value (AOV), repeat purchase rate / purchase frequency, cohort retention (repeat buyers by cohort), and time-to-first-purchase. Also track engagement signals that predict retention on your site: product page views per session, browse-to-cart ratio, and email click-to-purchase. Use GA4’s ecommerce event model (view_item, add_to_cart, purchase) to gather the canonical events; feed those events into a product analytics tool or warehouse for cohort LTV and repeat purchase analysis. Prioritize metrics that tie behavior directly to revenue and retention and instrument those events first. (owox.com)
Which should you choose?
| Your situation | Best fit |
|---|---|
| You need deep cohort, predictive retention and feature adoption | Amplitude |
| You want fast funnels, self-serve experiments and clearer price examples | Mixpanel |
| You need low-cost session replays and heatmaps to fix UX issues | Contentsquare |
| You need full session capture, console logs and privacy controls | FullStory |
| You want a free, universal view of acquisition and channel performance | Google Analytics 4 |
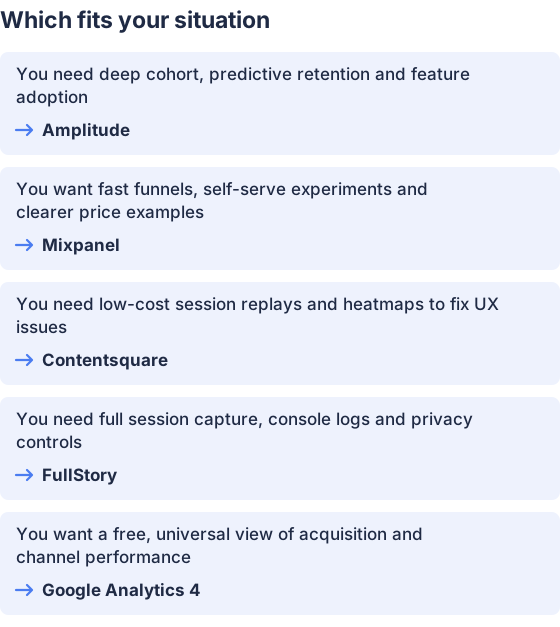
From the table above.
How this comparison was made
Prices and feature claims come from each vendor’s published pricing and product pages and were checked in November 2026; vendor pages linked above are the source for each row. The products were not tested hands-on for this comparison.